
How location impacts CAD salary is one of the most important variables hiring managers and HR teams must evaluate when benchmarking compensation. Geographic differences directly influence CAD designer salary ranges, hiring competitiveness, and overall talent acquisition strategy.
Understanding how regional demand, cost of living, and industry concentration affect CAD salaries helps organizations stay competitive while managing payroll budgets effectively.
Regional Salary Differences Across the United States

CAD salary ranges vary widely depending on where the role is based. A CAD technician salary in one metro area can differ significantly from another due to economic conditions and labor market demand.
High-demand urban centers typically offer higher salaries, but this often reflects increased living costs and competition for skilled professionals.
Key factors driving regional differences
- Cost of living adjustments
- Local industry demand for CAD professionals
- Availability of skilled talent
- Infrastructure and construction activity
- Presence of engineering, manufacturing, or architecture hubs
For hiring managers, aligning compensation with local benchmarks ensures stronger candidate attraction and retention.
Cost of Living and Salary Alignment

Cost of living plays a central role in determining CAD salary expectations. Employers in high-cost cities must offer higher wages to remain competitive.
High-cost vs lower-cost markets
In cities like San Francisco or New York City, CAD professionals expect significantly higher compensation due to housing, transportation, and general living expenses.
In contrast, cities such as San Antonio or Las Vegas often offer lower salary ranges while still maintaining strong purchasing power.
What this means for HR teams
- Salary benchmarking must include cost of living indexes
- Remote roles may require geo-adjusted pay strategies
- Competitive offers depend on local economic conditions
Industry Clusters and Their Impact on CAD Pay
Location impacts CAD salary heavily based on the concentration of industries that rely on CAD software and design professionals.
High-paying industry hubs
- Energy sector hubs like Houston
- Tech and product design centers like San Francisco
- Manufacturing regions such as Detroit
- Construction-heavy metros like Dallas
In these areas, demand for CAD designers, drafters, and engineers drives salary increases.
Lower-demand regions
Cities with fewer large-scale engineering or construction projects tend to have:
- Lower CAD salary ranges
- Smaller talent pools
- Reduced competition for hiring
Talent Supply and Demand Dynamics

The balance between available CAD professionals and employer demand directly affects salary levels.
High-demand markets
When demand exceeds supply, salaries rise quickly. Cities like Austin and Raleigh are seeing rapid growth, pushing CAD compensation upward.
Saturated markets
In regions with a larger pool of CAD talent:
- Salaries stabilize or grow more slowly
- Employers have more negotiation leverage
- Hiring timelines may shorten
Remote Work and Geographic Salary Adjustments
Remote work has introduced new complexities into CAD salary structures. Employers now have access to talent across multiple regions, but compensation strategies must remain competitive.
Common approaches
- Location-based pay adjustments
- National average salary bands
- Tiered geographic compensation models
Considerations for HR teams
- Pay equity across regions
- Candidate expectations based on local market rates
- Internal consistency for distributed teams
Even with remote roles, location continues to influence CAD salary expectations.
Competitive Hiring Strategies by Region
To attract top CAD talent, hiring managers must adapt compensation strategies to local conditions.
Effective approaches
- Benchmark against regional CAD salary data
- Offer relocation incentives in high-demand areas
- Adjust benefits to offset cost-of-living differences
- Use salary transparency to improve candidate trust
Additional factors beyond salary
- Work-life balance expectations
- Commute times and urban density
- Local job market competitiveness
These elements often influence candidate decisions as much as base pay.
Salary Data by City for CAD Professionals
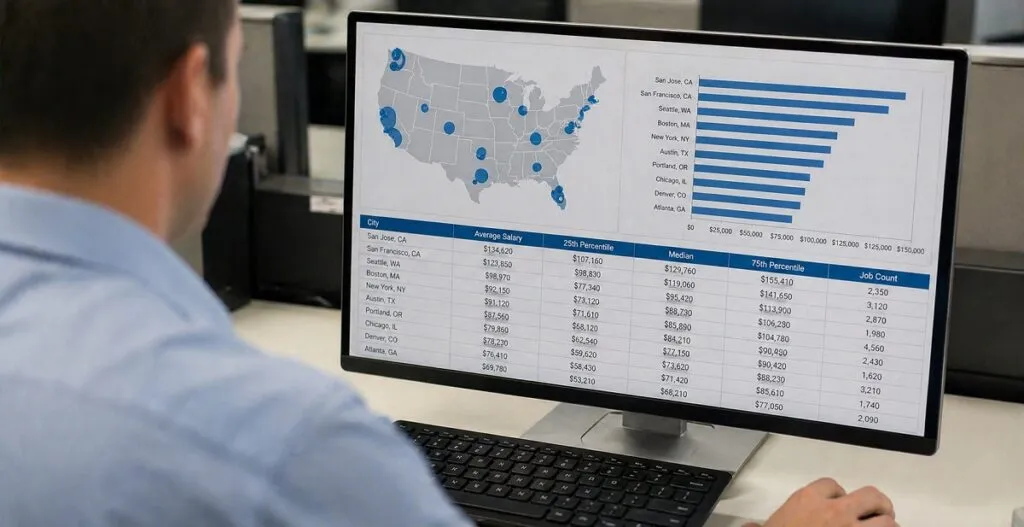
Presenting CAD salary data in a structured table makes it easier for hiring managers and HR teams to compare markets and make informed compensation decisions. Along with salary ranges, adding cost of living and market demand indicators provides deeper insight into how location impacts CAD salary.
| City | Average Salary Range | Median Salary | Cost of Living Index* | Market Demand | Key Industry Drivers |
|---|---|---|---|---|---|
| Denver | $65K – $85K | $75K | 110 | High | Construction, infrastructure |
| Houston | $70K – $95K | $82K | 95 | Very High | Energy, oil and gas |
| Chicago | $68K – $90K | $79K | 105 | High | Manufacturing, architecture |
| New York City | $80K – $110K | $95K | 170 | Very High | Construction, infrastructure |
| Orlando | $60K – $78K | $69K | 100 | Moderate | Tourism infrastructure, construction |
| Philadelphia | $65K – $88K | $76K | 102 | High | Healthcare facilities, construction |
| Phoenix | $63K – $82K | $72K | 103 | High | Real estate development |
| Dallas | $68K – $92K | $80K | 98 | Very High | Commercial construction |
| Raleigh | $66K – $89K | $77K | 96 | High | Tech infrastructure, development |
| San Francisco | $90K – $125K | $108K | 190 | Very High | Tech, product design |
| Atlanta | $64K – $85K | $74K | 97 | High | Logistics, construction |
| San Antonio | $58K – $75K | $66K | 92 | Moderate | Public infrastructure |
| Las Vegas | $60K – $78K | $68K | 101 | Moderate | Hospitality construction |
| Austin | $72K – $98K | $85K | 115 | Very High | Tech, commercial development |
| Miami | $62K – $80K | $71K | 107 | High | Real estate, coastal development |
| Los Angeles | $75K – $105K | $90K | 160 | Very High | Entertainment, construction |
| Boston | $78K – $102K | $90K | 150 | Very High | Engineering, biotech facilities |
| Detroit | $65K – $88K | $76K | 90 | High | Automotive manufacturing |
| Washington DC | $80K – $108K | $94K | 155 | Very High | Government, infrastructure |
| Minneapolis | $67K – $90K | $78K | 102 | High | Manufacturing, healthcare |
*Cost of Living Index is based on a national average of 100.
How to Use This Data for Hiring Decisions
This table goes beyond basic CAD salary comparisons by incorporating multiple factors that influence compensation.
Salary Range vs Median Salary
The range shows market variability, while the median gives a clearer benchmark for typical offers. HR teams often anchor offers near the median and adjust based on experience.
Cost of Living Index
Higher indexes indicate increased living expenses. Cities like San Francisco and New York City require higher CAD salaries to remain competitive.
Market Demand
“Very High” demand signals competitive hiring environments where faster offers and stronger compensation packages are necessary.
Key Industry Drivers
Understanding local industries helps explain why CAD salary levels differ. For example, energy projects in Houston or tech expansion in Austin directly influence salary growth.
Practical Takeaways for HR and Hiring Managers
- Use median salary as a baseline, then adjust for experience and specialization
- Factor in cost of living when hiring remotely or relocating candidates
- Prioritize speed and competitive offers in high-demand markets
- Align compensation strategy with local industry demand
A structured, data-driven approach to location-based CAD salary benchmarking helps organizations remain competitive while optimizing hiring outcomes.
Location remains one of the most influential factors shaping CAD salary structures. For hiring managers and HR professionals, aligning compensation with geographic realities is essential for attracting top-tier CAD talent while maintaining internal equity and budget efficiency.
Content reviewed and published by Tier2Tek Staffing Editorial Team .